Dashboard
The MCP Mesh Dashboard provides real-time visibility into your agent mesh — agent health, inter-agent traffic, dependency topology, and live call tracing.
Accessing the Dashboard
Local development:
Opens the dashboard at http://localhost:3080.
Kubernetes:
The published mcpmesh/ui image serves at /ops/dashboard by default. Enable it in your Helm values:
See meshctl man deployment for ingress routing and custom basePath configuration.
Pages
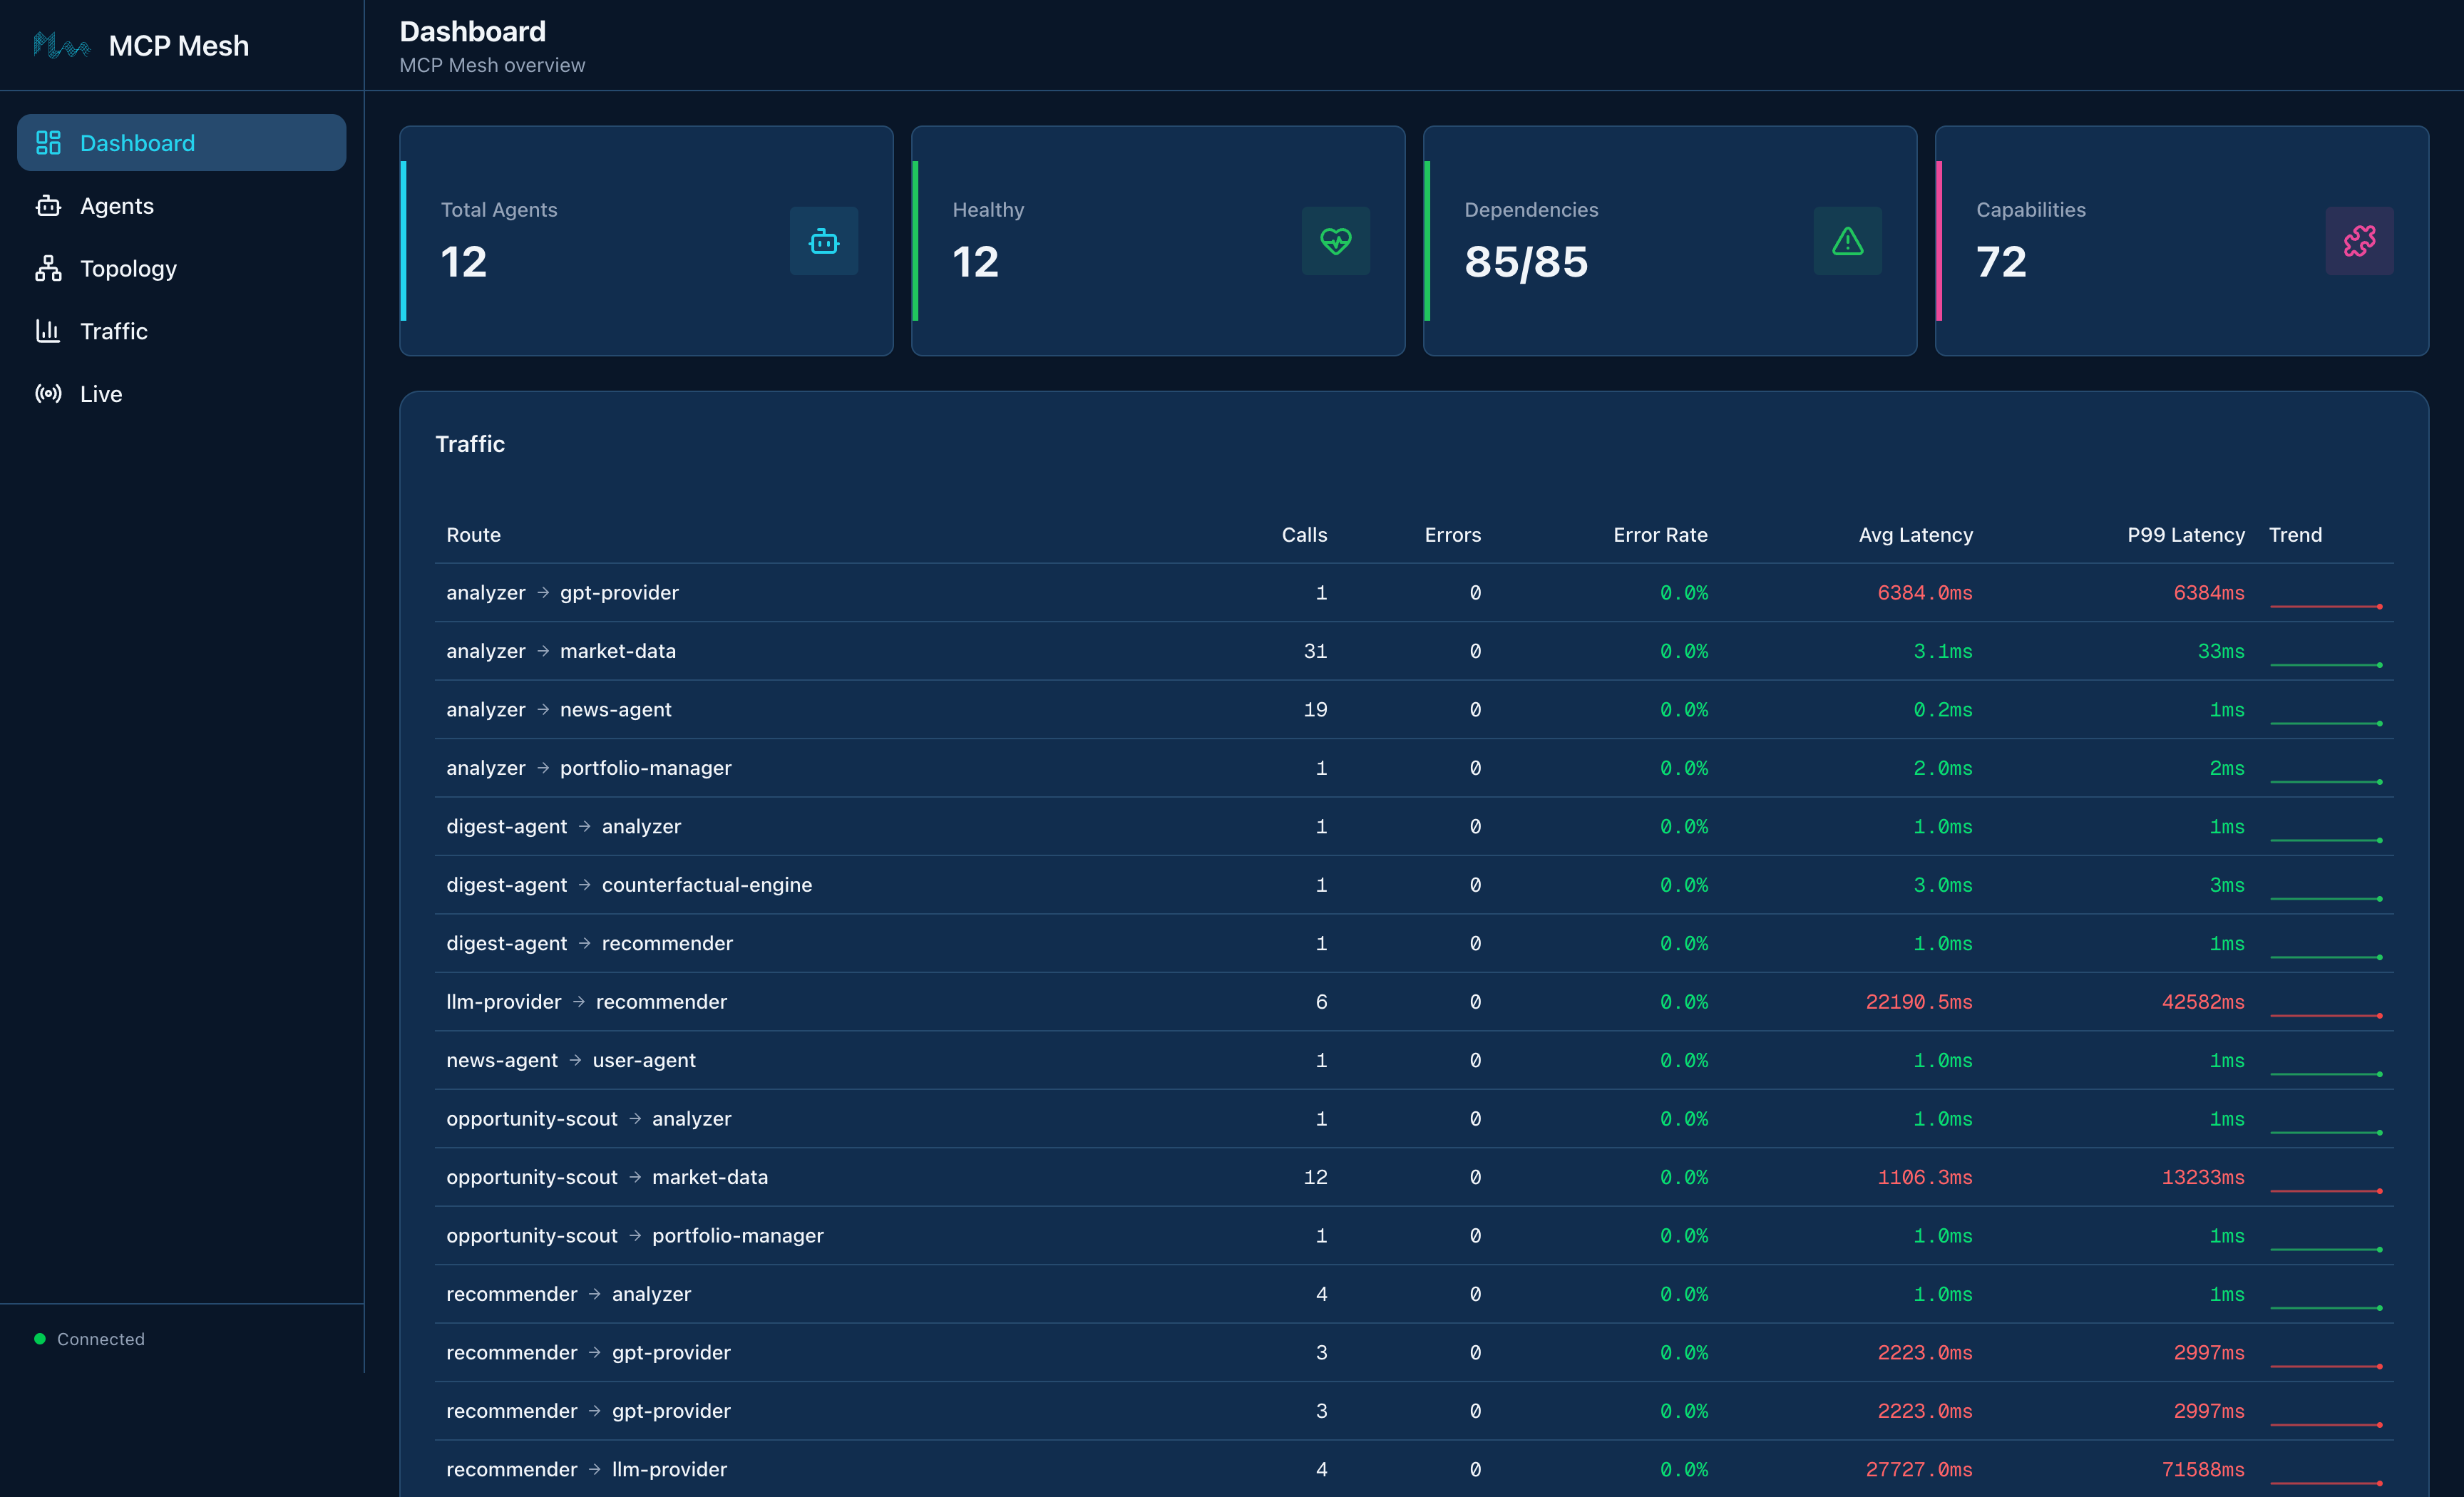
Dashboard
The main overview shows agent count, health status, dependency resolution, and capabilities at a glance. The traffic table displays per-edge call metrics including call count, error rate, latency (average and P99), and trend sparklines.
Real-time events stream in the sidebar — agent registrations, deregistrations, and status changes appear as they happen.
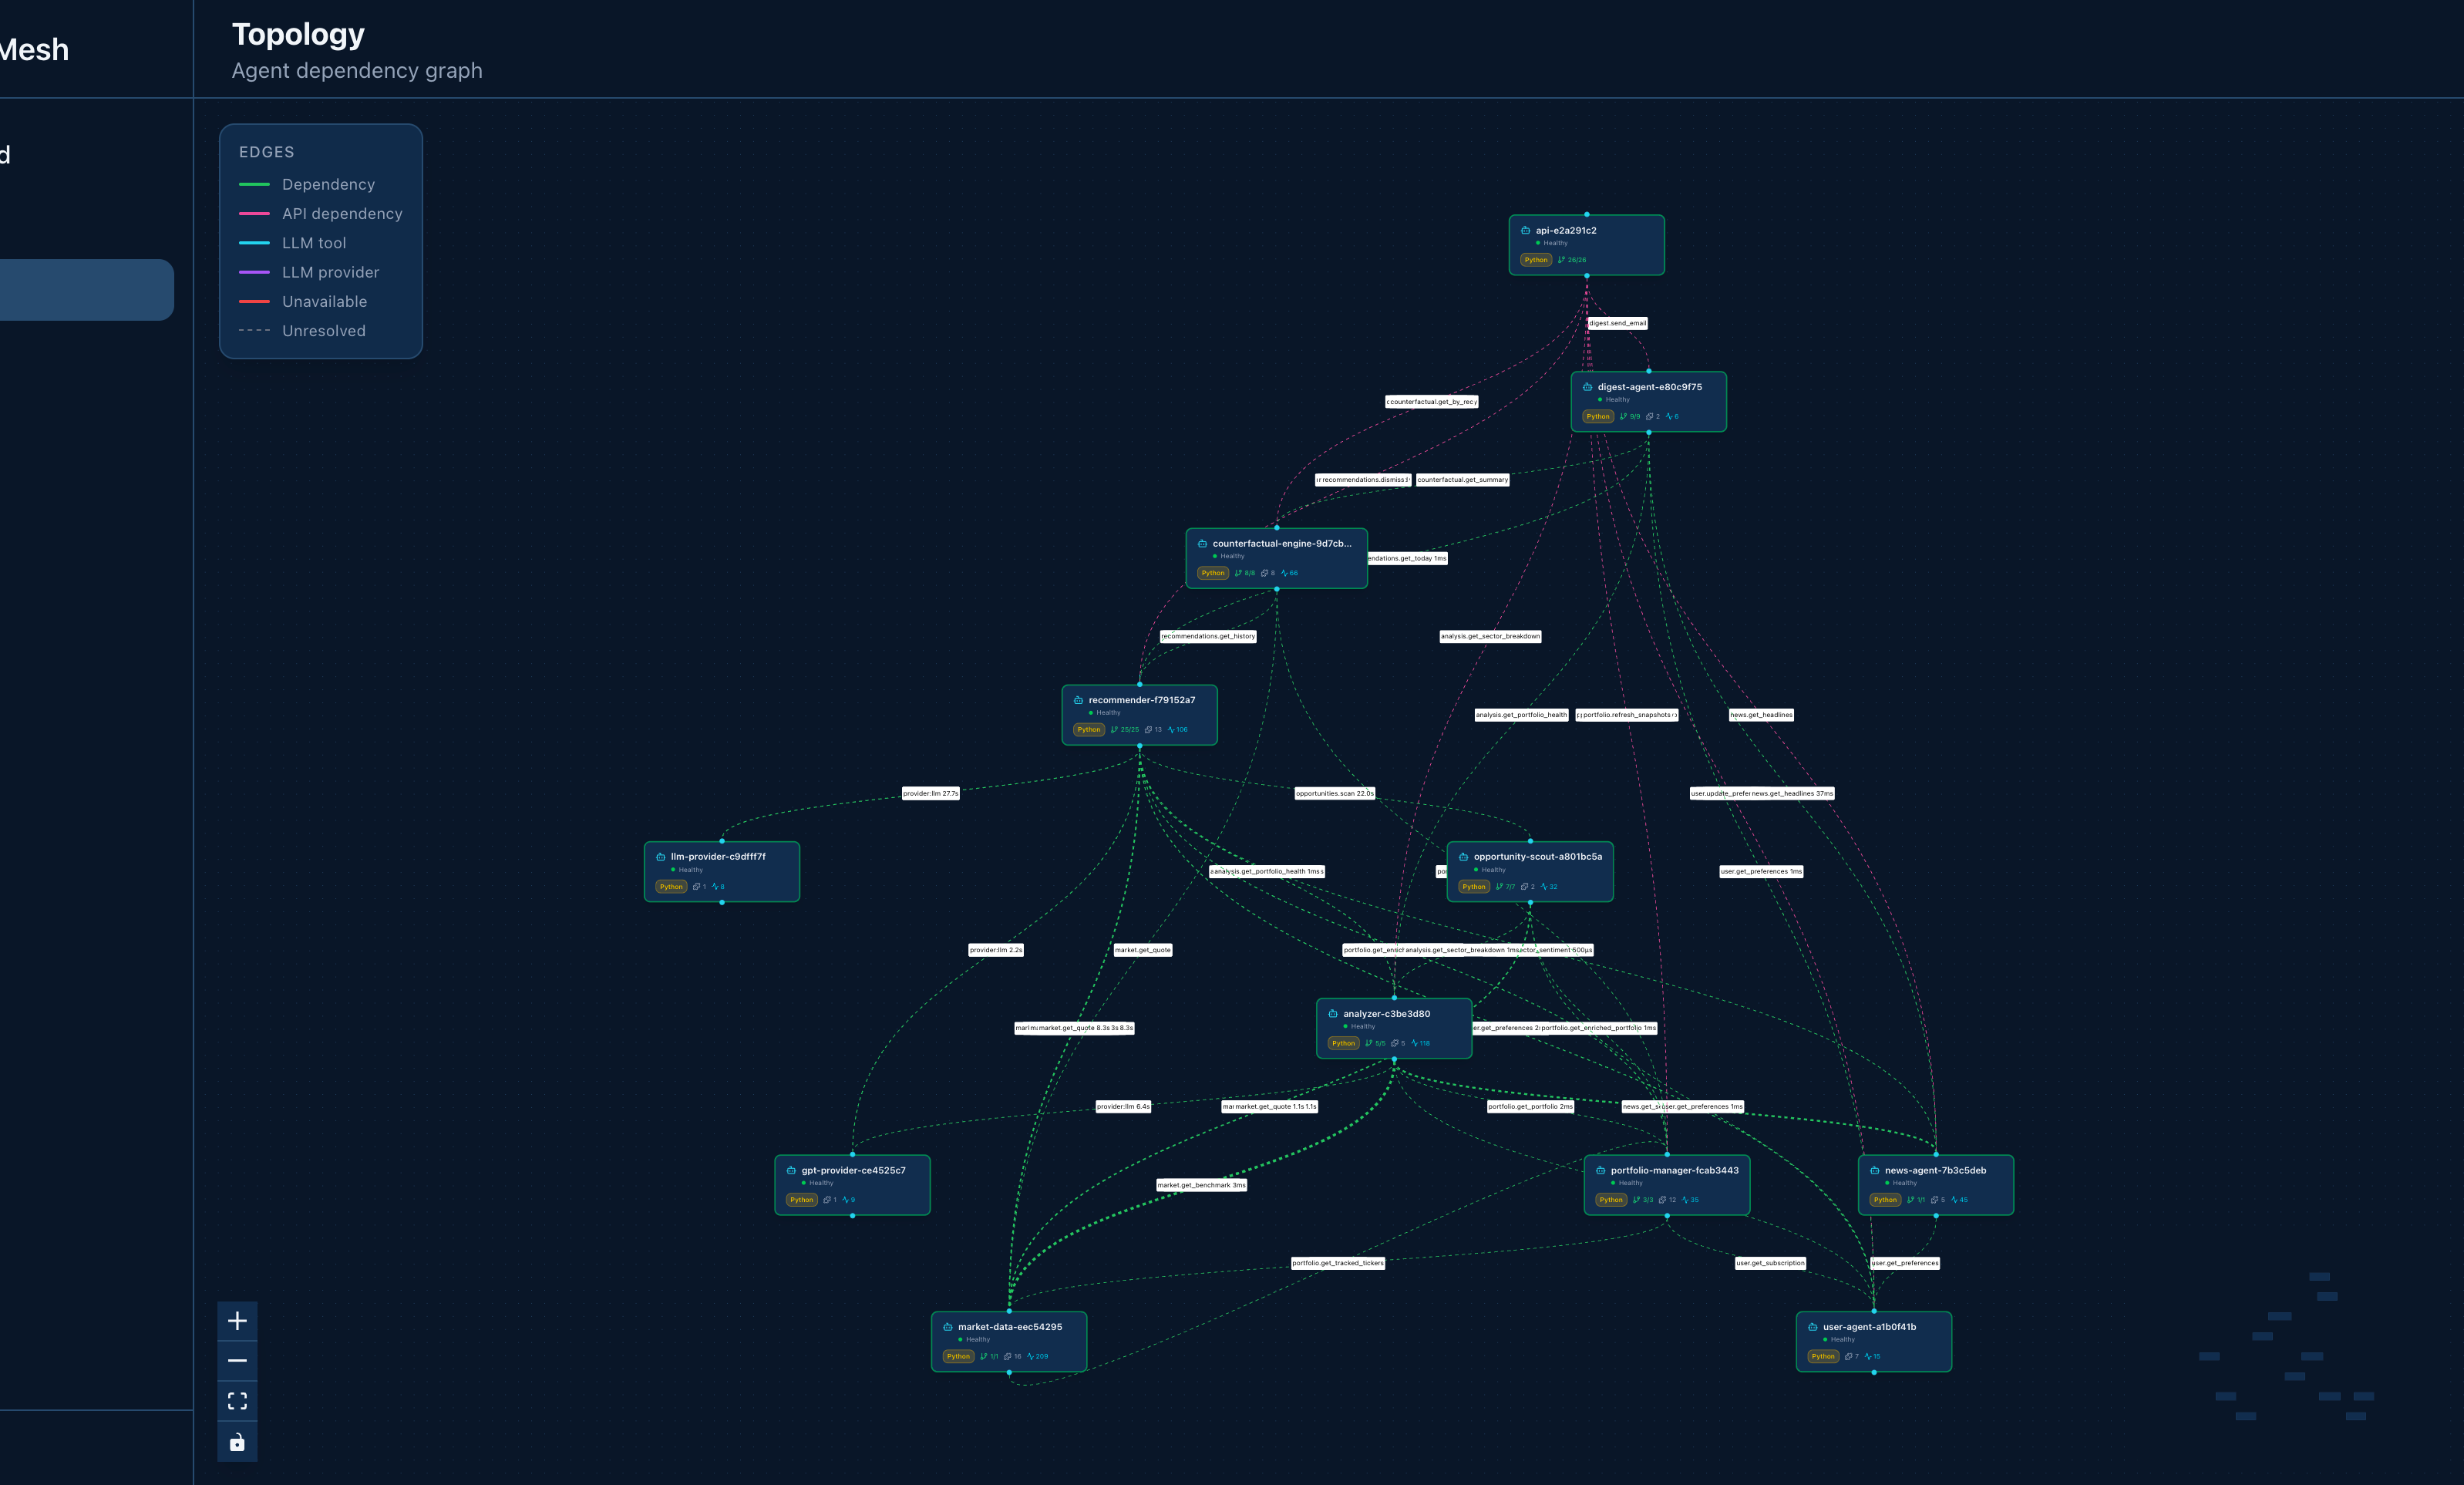
Topology
The topology view renders the full agent dependency graph. Nodes represent agents, edges represent dependencies. The layout uses dagre for automatic hierarchical positioning.
Color coding shows agent types (tool agents, LLM agents, LLM providers) and edge states (resolved, unresolved). Hover over nodes for details — runtime, version, capabilities, and endpoint.
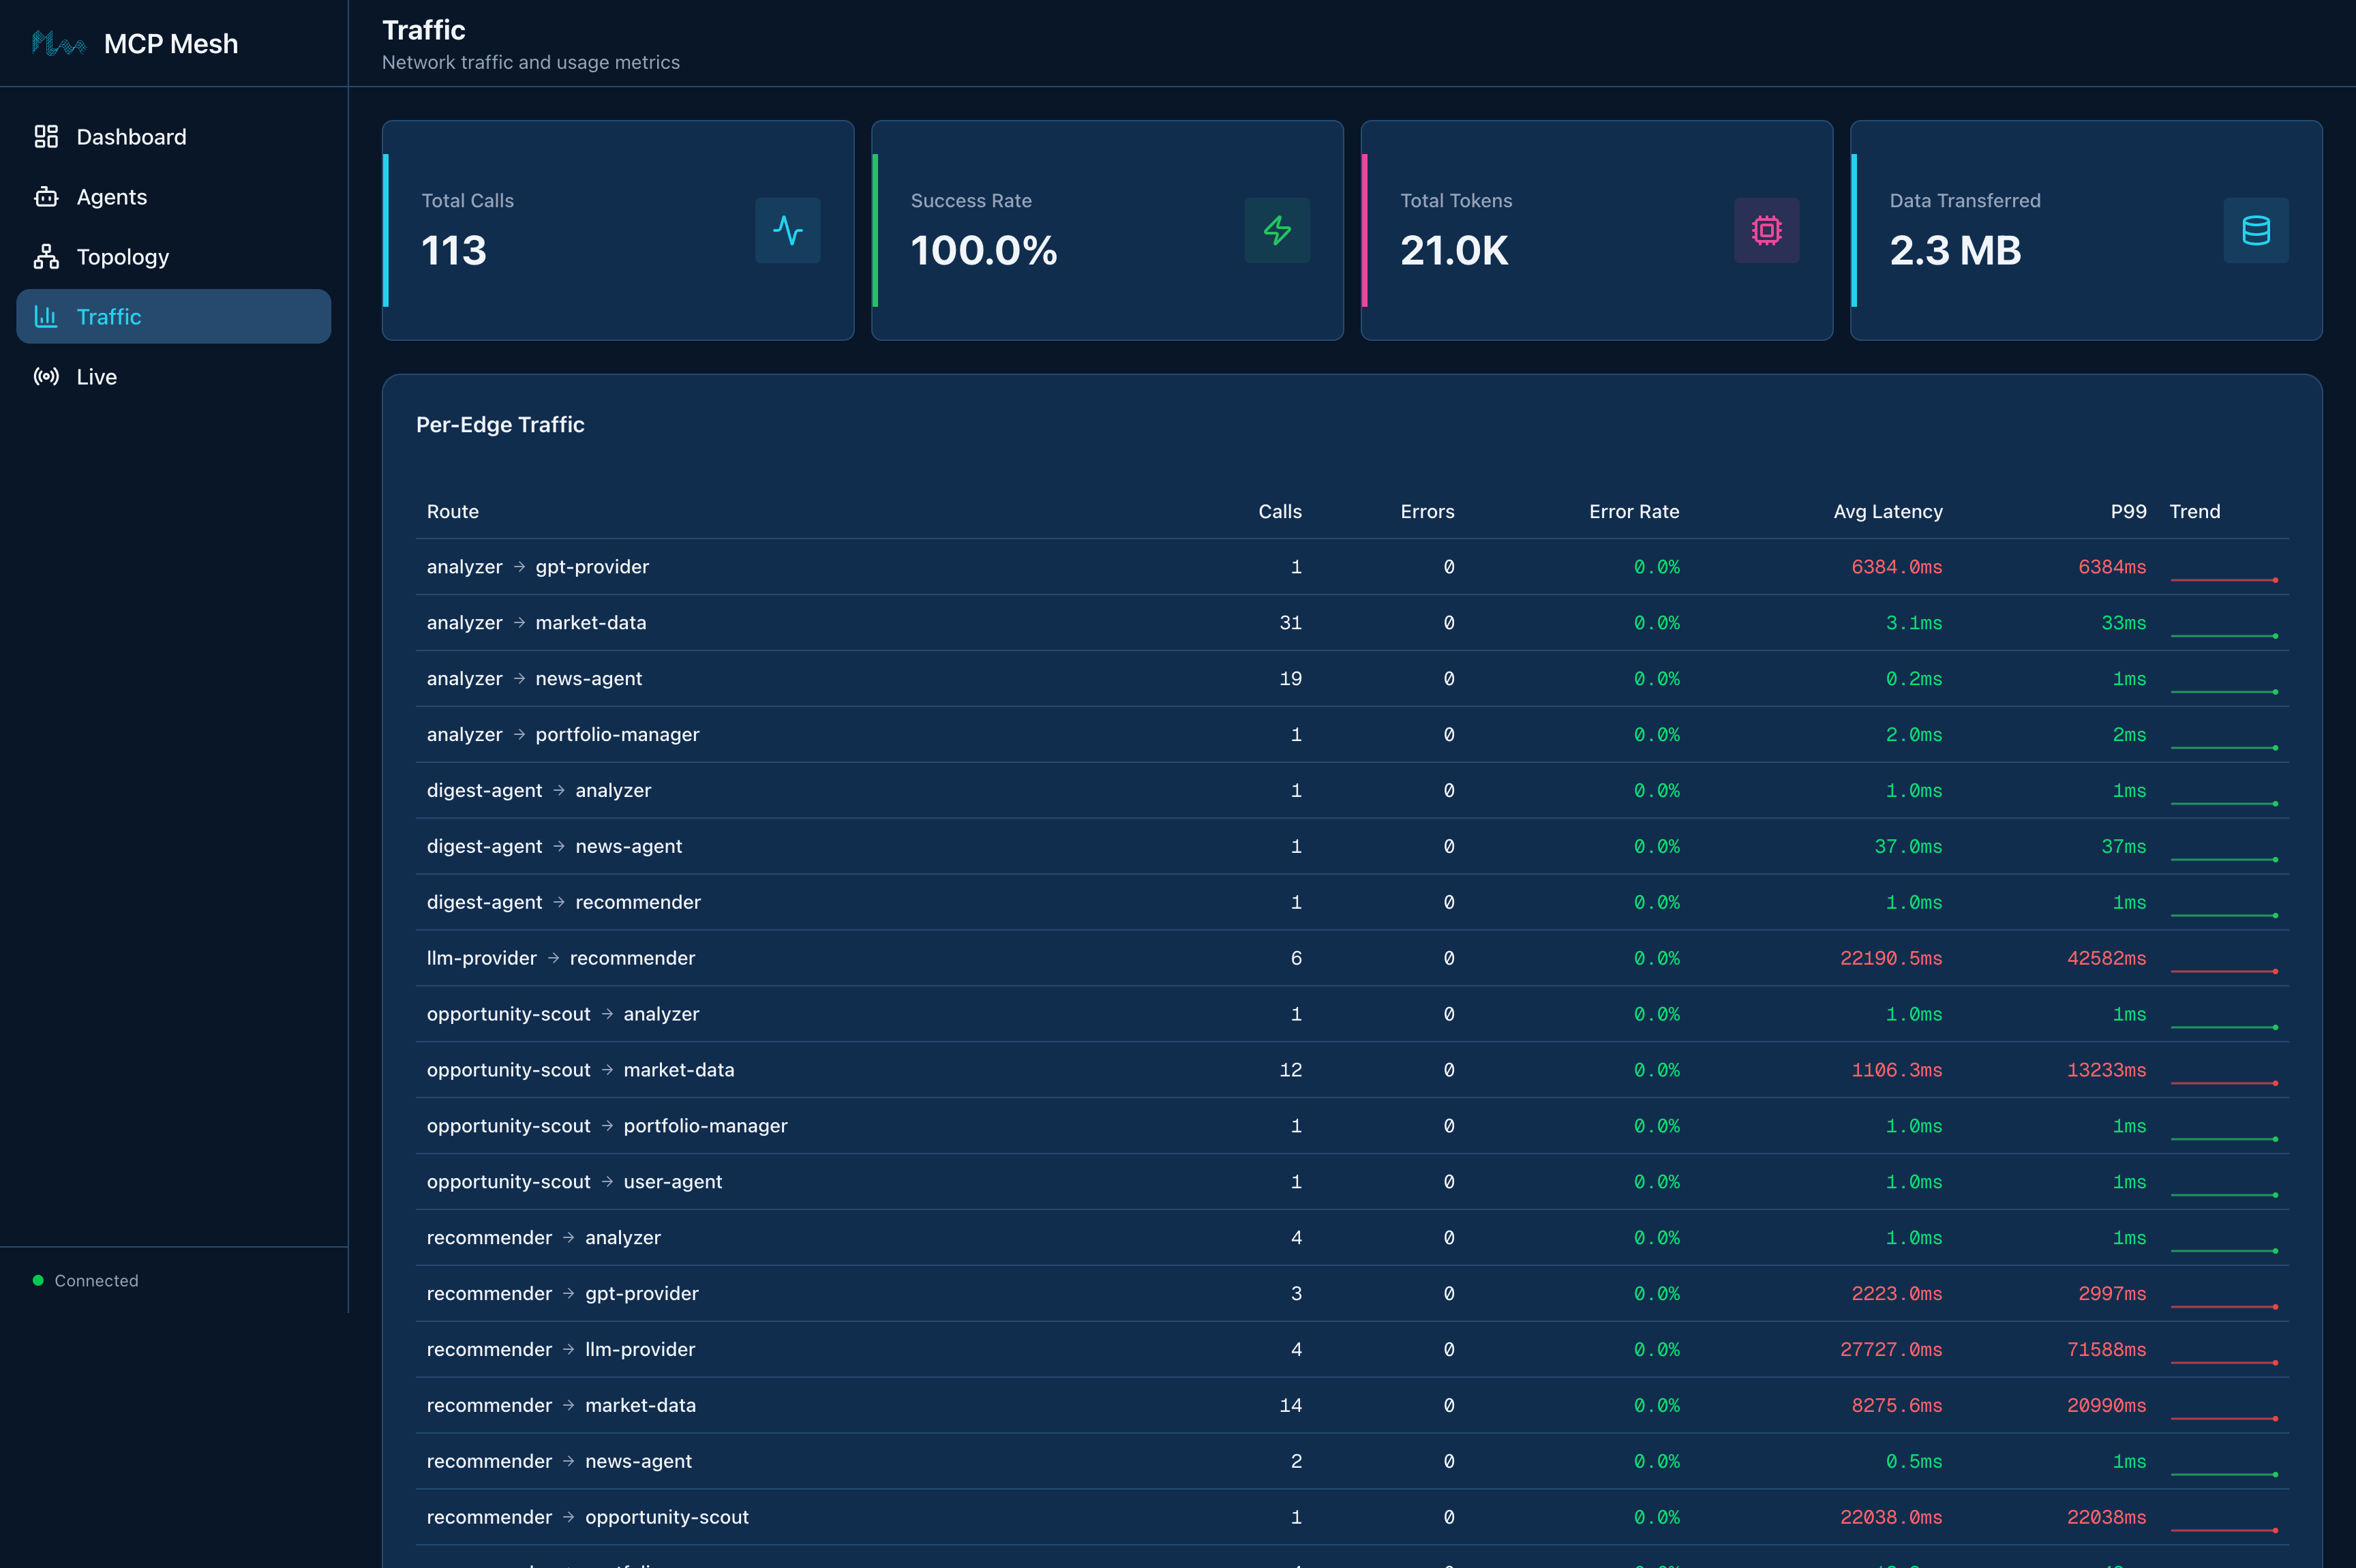
Traffic
Detailed inter-agent traffic metrics. The top cards show aggregate stats — total calls, success rate, token usage, and data transferred.
The per-edge traffic table breaks down every agent-to-agent route with call counts, errors, error rate, average latency, P99 latency, and trend sparklines. Below that, per-agent stats show spans, token usage, and data volume for each agent individually.
Token usage by model shows which LLM models are being used and their token consumption.
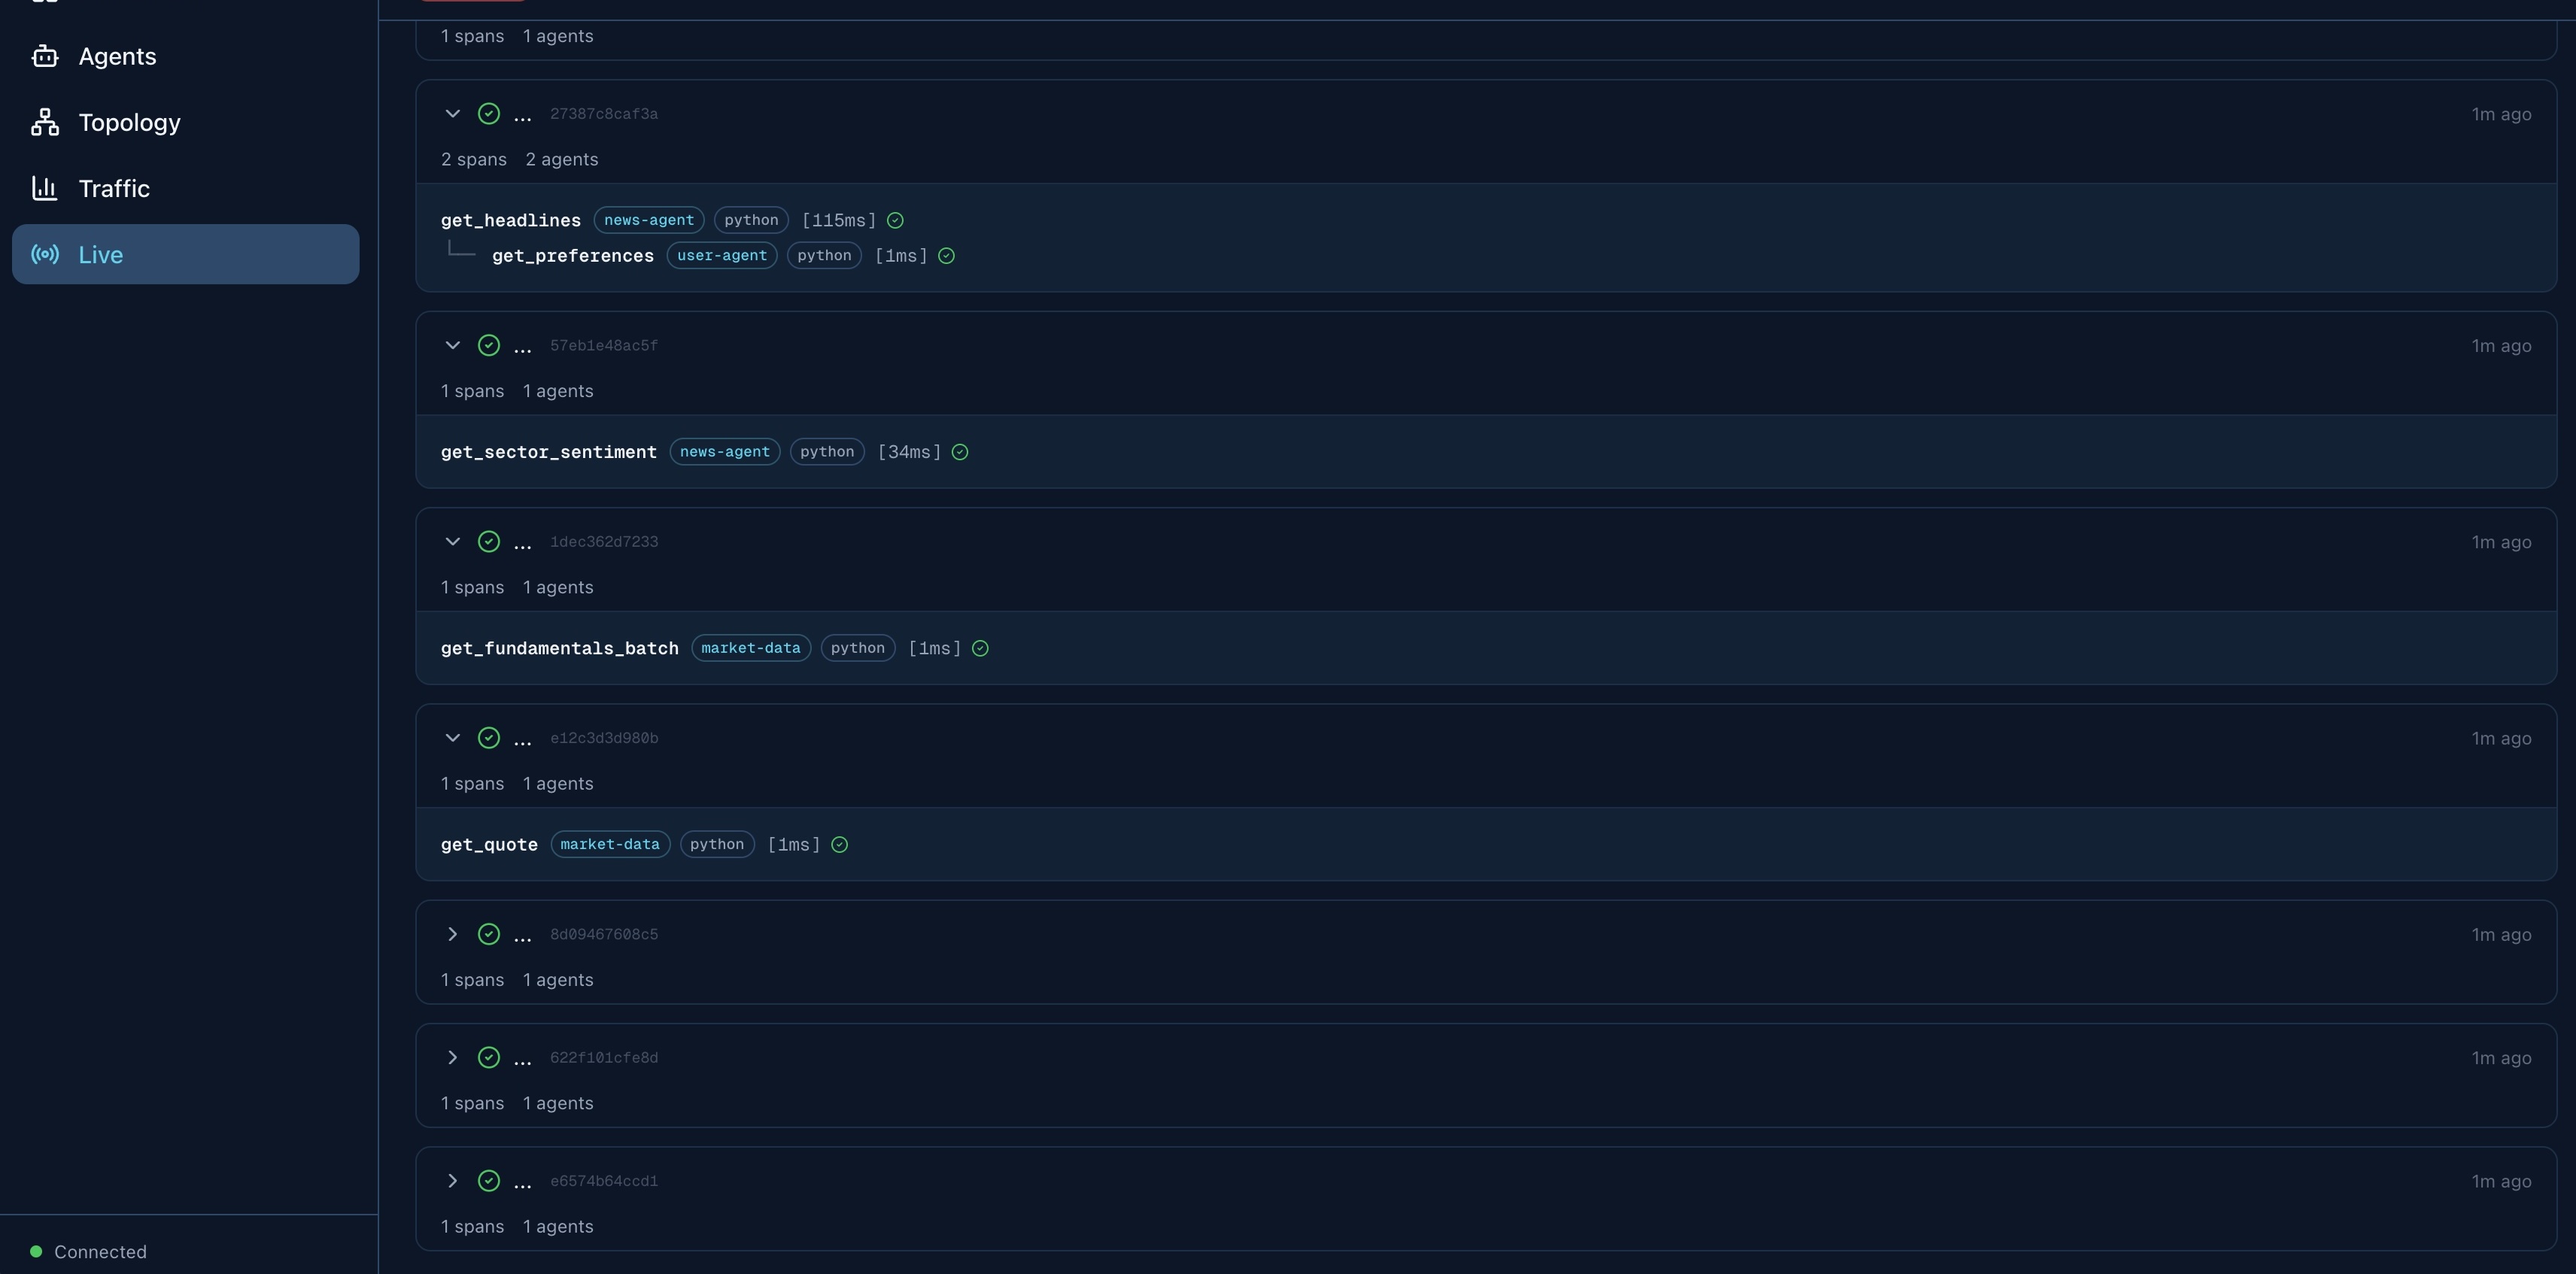
Live
Real-time trace streaming. As agents process requests, spans appear showing the call flow across the mesh — which agent called which tool, on which target agent, with timing and status.
Each trace can be expanded to see individual spans with agent names, runtimes, operation names, and durations. Traces are grouped by trace ID and sorted by recency.
Agents
A table of all registered agents showing name, type, runtime, version, dependency resolution status, and last seen time. Expand any agent row to see its capabilities, dependencies, and recent traces.
Architecture
The dashboard is a Next.js static export embedded in a Go server (meshui). The Go server:
- Serves the SPA and static assets
- Proxies
/api/*requests to the registry - Provides SSE endpoints for real-time event and trace streaming
- Connects directly to the database for event history
- Connects to Redis for live trace accumulation
No separate frontend server is needed — everything is a single binary.